The Hours Your AI Saves Are Not Where the Value Shows Up
Three 2026 datasets locate the return on AI in capital allocation and product, not in hours saved. Your business case is measuring the weakest line.
Pull up the last AI business case your organization approved and look at its first number. It is almost always hours. Hours saved per invoice or per support ticket, multiplied into full-time equivalents and converted into currency.
Now look for the number that says where those hours went. In most business cases I read, there isn’t one. Three separate 2026 datasets suggest that missing number is where the money actually is, and that the hours line is the weakest evidence in the document.
Key takeaways
- Private-market buyers barely pay for AI productivity work. In McKinsey’s 2026 sample of 471 private-equity-backed companies, firms using AI opportunistically traded at a median revenue multiple of 13x, and firms that rebuilt their operating models around AI traded at 14x.
- Measured AI gains show up in capital allocation rather than operating efficiency. A 2026 Journal of Empirical Finance study of 16,145 firm-years found AI adoption associated with 2.17% higher investment efficiency at the mean, while standard productivity metrics showed no systematic gain.
- Self-reported gains from a measurement system run roughly four times the audited ones. A 2023 meta-analysis of balanced-scorecard research found an effect size of 0.747 when executives were surveyed and 0.188 when performance came from financial data.
- An AI business case needs a second line, meaning a named decision, offering, or capital allocation that changes because the efficiency line moved. Stanford’s 2026 study of 51 deployments found revenue impact wherever someone measured the revenue side rather than the cost side alone.
- AI cost estimates are incomplete without process redesign, change management, and one failed attempt. Stanford found that 77% of the hardest challenges were invisible costs and that 61% of successful projects followed an earlier failure whose spend never entered the final ROI.
Private markets barely pay for the productivity story
McKinsey’s private capital team analyzed 471 private-equity-backed companies across 31 industries and 30 countries, covering deals completed from 2023 onward, and sorted them into four levels of AI maturity. Level one is opportunistic use, meaning pilots and individual tools. Level two rebuilds the operating model around AI. Level three embeds AI inside the product. Level four builds new businesses on it.
The median revenue multiples come out at 13x, 14x, 20x, and 31x across those four levels. Everything the standard business case promises sits between 13x and 14x. The authors state the implication directly: markets do not materially differentiate between companies that use AI for productivity and those that integrate it into their operating models. Valuations rise when AI changes what the company sells, not how it operates.
Revenue efficiency splits along the same seam. Median revenue per employee rises about 19% between levels one and two, then jumps from $118,000 to $180,000 between levels three and four, a 52% increase.
This is one consultancy’s sample of private companies, and multiples are prices rather than returns anyone has banked. Take the ranking, not the decimal places. It says the work your business case describes has already been priced as table stakes, which rhymes with what public-market investors reward once AI has to show up in the numbers.
Look at how McKinsey’s own chart draws it: levels one and two are not two bars, they are one.
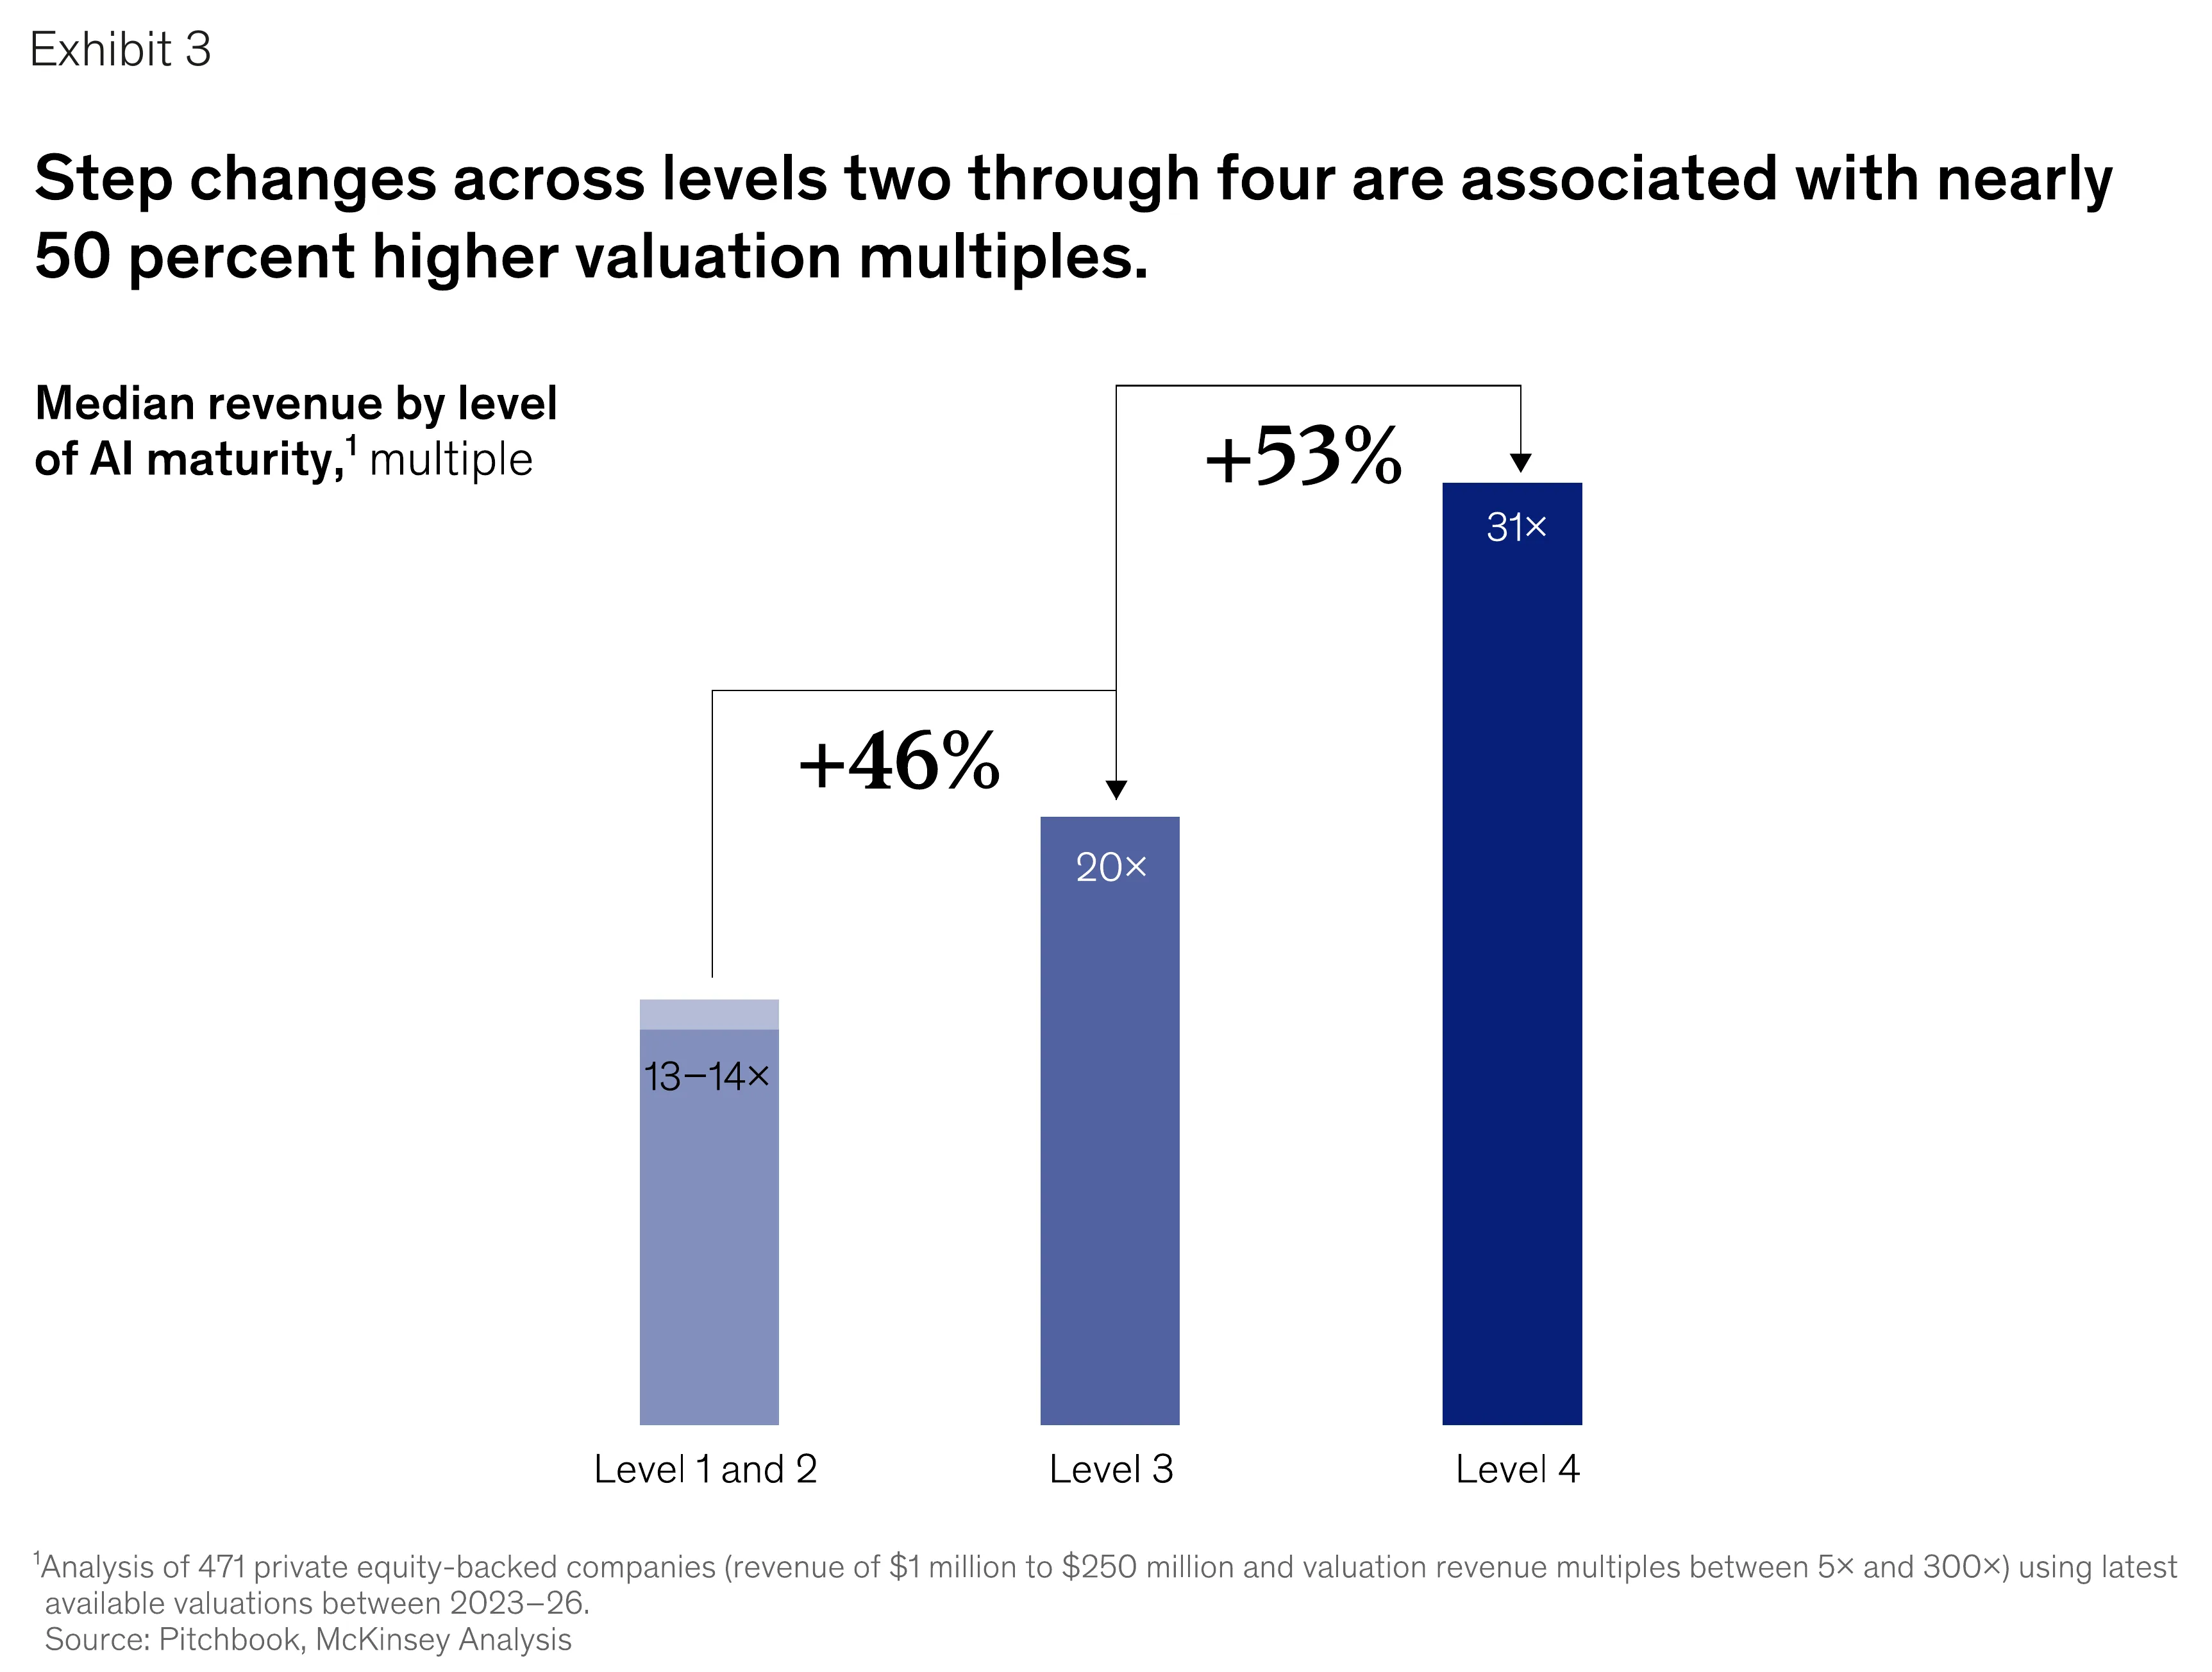
Exhibit 1. Median revenue multiple by AI maturity level across 471 private-equity-backed companies, with levels one and two collapsed into a single 13-14x band. Each bar is the median revenue multiple, meaning valuation divided by revenue, for companies at that level of artificial intelligence (AI) maturity. The left bar covers levels one and two together at 13-14x, level 3 sits at 20x and level 4 at 31x, with the arrows marking the +46% and +53% step changes between them. The detail worth noticing is the drafting choice: opportunistic AI use and a fully rebuilt operating model were too close to justify separate bars. Source: Pulido, A., Yegoryan, H., Bleys, J., & Haas, S. (2026). Beyond productivity: How AI creates value in private equity. McKinsey & Company, Exhibit 3, p. 7.
The measurable gain sits in capital allocation
The strongest evidence here is not a survey. Chen, Kim, and Peng, publishing in the Journal of Empirical Finance in 2026, tracked 2,401 US firms over 16,145 firm-years from 2010 to 2021, measuring AI adoption by the density of AI terminology in senior management remarks on earnings calls and measuring investment efficiency as the deviation from expected investment given growth opportunities.
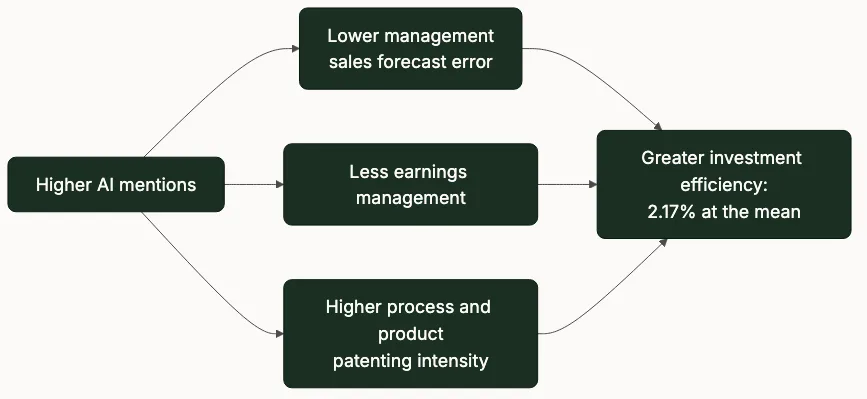
A one-standard-deviation increase in AI mentions is associated with 2.17% higher investment efficiency at the mean and 3.65% at the median. It survives a two-stage least squares specification instrumented by industry exposure to university-authored AI research, with a Cragg-Donald F-statistic of 118.83. The mechanisms the authors identify are all informational: lower management sales forecast error over multi-year horizons, less earnings management, and higher process and product patenting intensity.
Then there is the result buried in footnote 14. Standard operating efficiency metrics, meaning operating expenses, sales per worker, and revenue-based productivity measures, provide little systematic evidence of gains. The authors report that as an untabulated test, so read it as a secondary check rather than a headline result. It still points one way, because the tabulated finding beside it is the positive one on investment efficiency. The paper also places the improvement in firms prone to underinvestment rather than overinvestment.
Read those results together. Across 16,145 firm-years, AI adoption did not show up as measurably cheaper existing work. It showed up as a firm getting better at deciding which work to fund, and the association was strongest where the firm had been funding too little. That is a return on decision infrastructure rather than on labor, and almost no business case is written to detect it.
The balanced scorecard already ran this experiment
This is not the first time an organization has adopted a measurement system and assumed the measuring would do the improving.
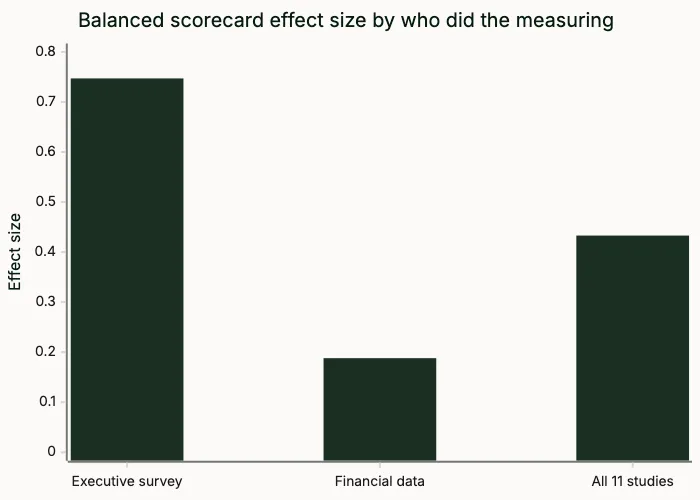
Tawse and Tabesh’s 2023 meta-analysis in Business Horizons pooled the 11 published studies that quantified the relationship between balanced scorecard adoption and firm performance. The overall effect size was 0.433, moderate and real. The split underneath it is the part worth pinning to your wall: 0.747 when performance was captured through executive surveys, 0.188 when it came from objective financial data. Same tool, a four-fold gap depending on who held the ruler. KPMG’s estimated failure rate for scorecard adoption projects was 70%.
The authors also found what separated the working implementations from the decorative ones. Roughly half of adopters, 51% in one survey, treated the scorecard as financial and nonfinancial measures with no causal link between the measures and the goals. Where that link was explicit, the effect size rose by 0.321.
I’d argue the AI business case is repeating this. It counts the activity it can see, it is scored by the people who sponsored it, and it rarely states the causal chain from the metric to the outcome it was funded to move.
The second-line test
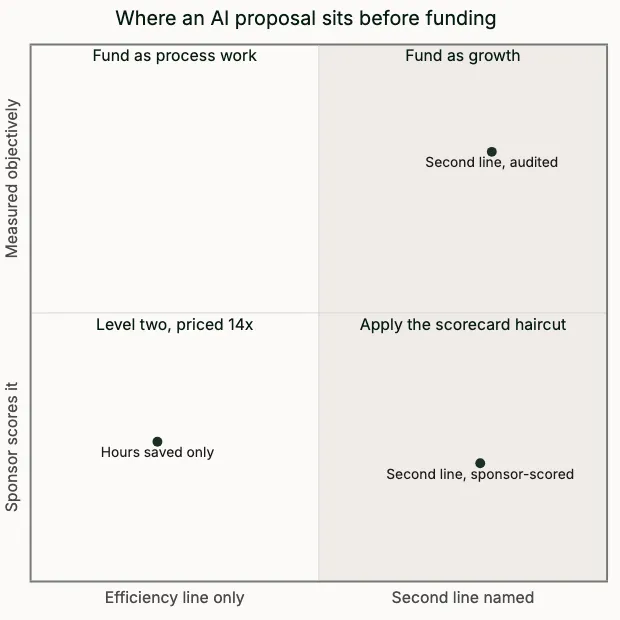
Here is the check I would apply to any AI proposal before it reaches an investment committee. Call it the second-line test, and it has two parts.
The first line is the efficiency claim: the hours or cost the system removes. Almost every case has this one, and it is the easy half.
The second line names the destination. Which decision changes, which offering changes, or which capital allocation moves because the first line moved, with a named owner and a measure that does not come from a survey of the sponsors. A case with no second line is a level-two case, and the private-equity data says level two is priced at 14x against level one’s 13x.
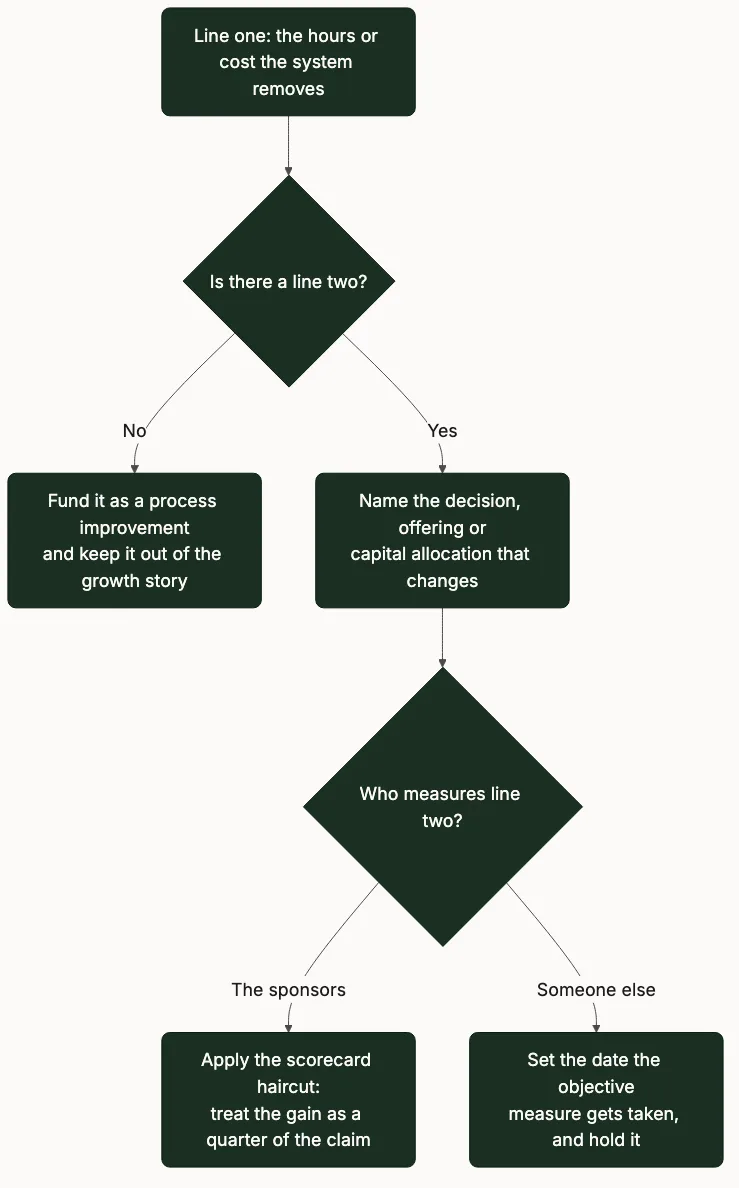
Three rules follow from the evidence:
If a proposal has only a first line, fund it as a process improvement and keep it out of the growth story. It may still be worth doing. The recruiting deployment in Stanford’s sample cut time per role from three hours to three minutes, and it also lifted candidate conversion by 75%, which I would count as a second line because conversion measures the hiring outcome and not the screening effort.
If the second line will be measured by the same people who sponsored the deployment, apply the scorecard haircut. In the balanced-scorecard literature the audited effect ran at 0.188 against 0.747 self-reported. I would carry that ratio across as a working discount: treat a sponsor-reported AI gain as roughly a quarter of its claim until an objective measure lands. The place this breaks in practice is mundane. The person who wrote the estimate is usually the person who later reports the result, and few review agendas make that separation explicit. I’d treat splitting those two roles as the cheapest control available here.
If the cost side has no line for process redesign, change management, and one failed attempt, the case is incomplete rather than conservative. Stanford’s 51 deployments put 77% of the hardest challenges in invisible costs, and 61% of the successful projects had a prior failure whose spend never appeared in the winning project’s ROI.
The Stanford team asked practitioners what was hardest to fix, and the answers land almost entirely outside the model.
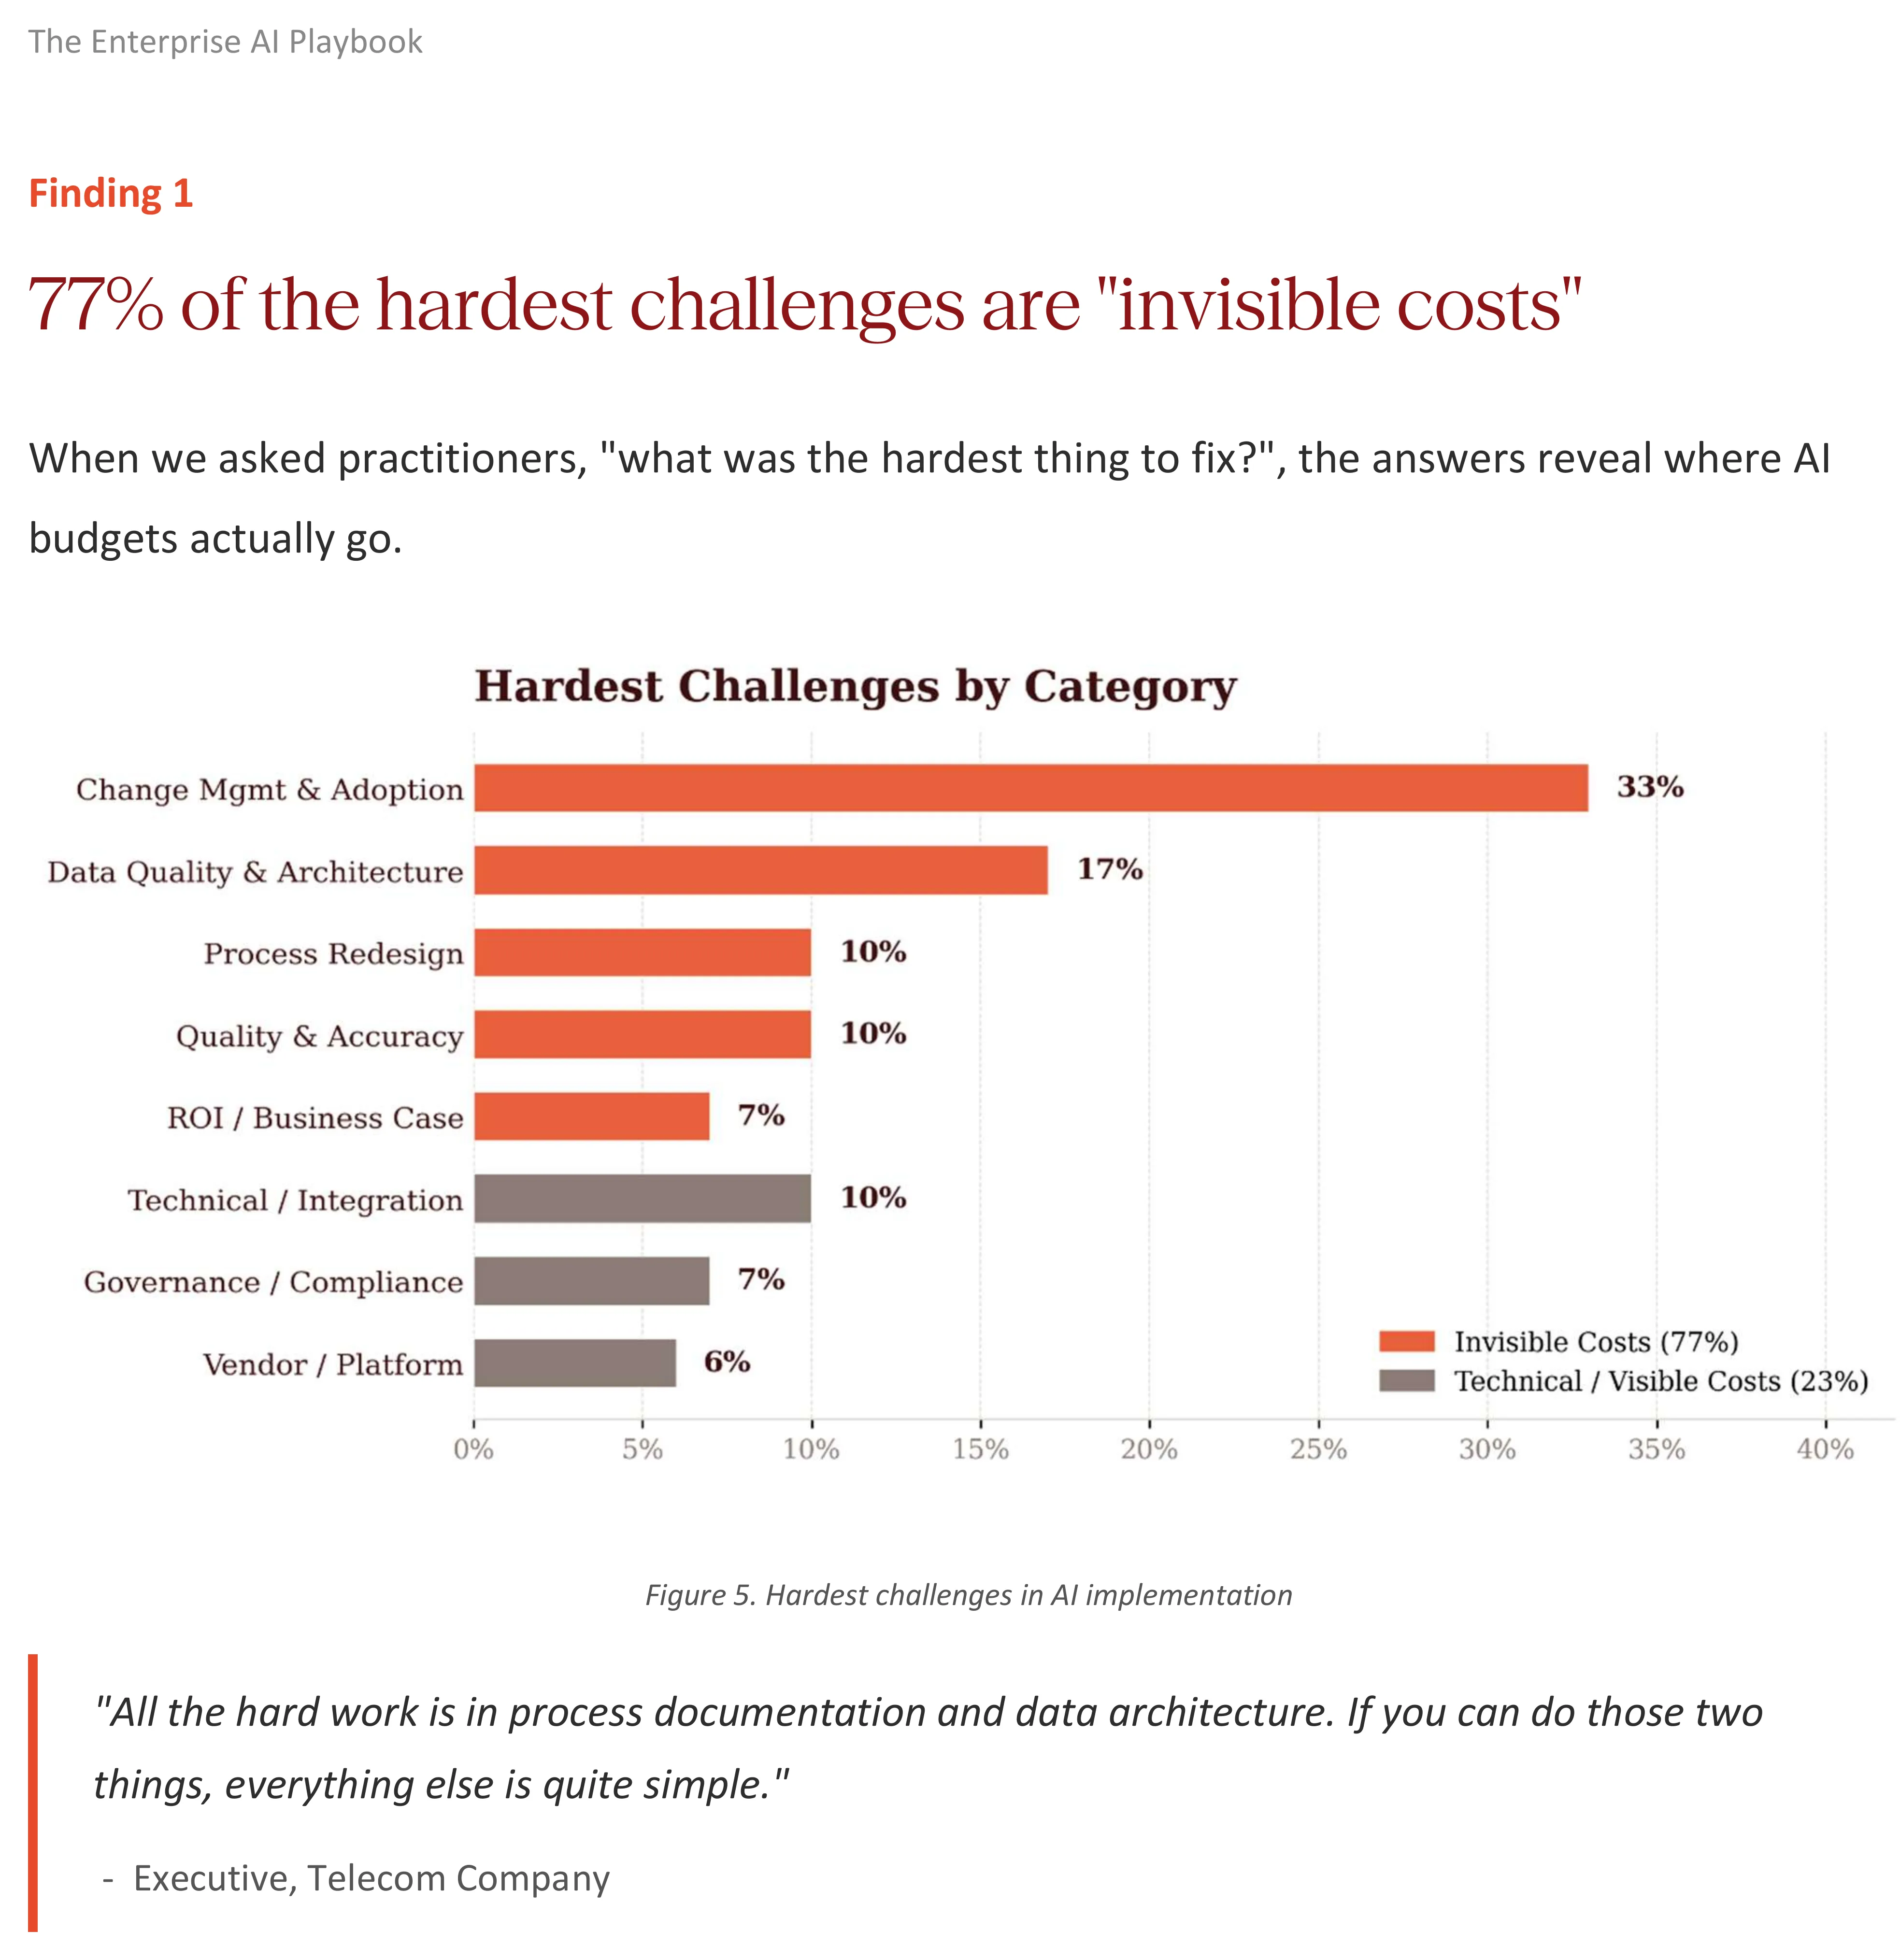
Exhibit 2. Hardest challenges reported across 51 enterprise AI deployments, split between invisible costs at 77% and technical or visible costs at 23%. Each bar is the share of practitioners naming that category as the hardest thing to fix in an artificial intelligence (AI) deployment. Orange bars are the invisible costs, 77% combined: change management and adoption 33%, data quality and architecture 17%, process redesign 10%, quality and accuracy 10%, and ROI or business case 7%. Grey bars are the technical and visible costs, 23% combined: technical integration 10%, governance and compliance 7%, vendor and platform 6%. The model itself never appears as a category. Source: Pereira, E., Graylin, A. W., & Brynjolfsson, E. (2026). The Enterprise AI Playbook: Lessons from 51 Successful Deployments. Stanford Digital Economy Lab, Figure 5, p. 14.
What to change in the next review cycle
The Stanford researchers found revenue impact in a minority of their cases, and their explanation is one sentence long: what distinguished those cases was that someone measured the revenue side, not just the cost side. Deloitte’s 2026 survey of 3,235 leaders, cited in the same report, found 74% of organizations hoping to grow revenue through AI and 20% doing it.
The practical moves are small and unglamorous. Write the second line before deployment, not at the review after. Pick indicators from the quality, customer value, and revenue families rather than defaulting to head count, which is the appendix the Stanford team wrote for exactly this reason. Set the date when the objective measure gets taken, and hold it.
None of this makes AI cheaper. It makes the payoff legible, which is the real constraint on moving AI from a set of experiments to infrastructure. A year from now the hours line will have decayed into a baseline nobody remembers agreeing to. The decision that changed will still be traceable in what got funded.
References
- Chen, S.-S., Kim, J., & Peng, S.-C. (2026). The real effects of AI: Evidence from corporate investment efficiency. Journal of Empirical Finance, 88, 101730. https://doi.org/10.1016/j.jempfin.2026.101730
- Tawse, A., & Tabesh, P. (2023). Thirty years with the balanced scorecard: What we have learned. Business Horizons, 66(1), 123-132. https://doi.org/10.1016/j.bushor.2022.03.005
- Pulido, A., Yegoryan, H., Bleys, J., & Haas, S., with Lin, C., Gautam, J., Brondholt, M., & Sharma, S. (2026). Beyond productivity: How AI creates value in private equity. McKinsey & Company, Private Capital and Business Building Practices.
- Pereira, E., Graylin, A. W., & Brynjolfsson, E. (2026). The Enterprise AI Playbook: Lessons from 51 Successful Deployments. Stanford Digital Economy Lab, Stanford University.
Frequently asked questions
Does AI actually improve productivity in enterprises?
The measured evidence is weaker than the business cases assume. Chen, Kim, and Peng's 2026 study of 16,145 firm-years found little systematic evidence of gains in operating expenses, sales per worker, or revenue-based productivity, while investment efficiency and management forecast accuracy did improve.
Where does AI value show up if not in hours saved?
In capital allocation and in what the company sells. The Journal of Empirical Finance study links AI adoption to more efficient investment and more accurate management forecasts, and McKinsey's analysis of 471 private-equity-backed companies shows revenue multiples rising from 14x to 20x only when AI is embedded in the product.
How should a product leader write an AI business case?
Include a second line. Beyond the hours or cost removed, name the decision, offering, or capital allocation that changes as a result, give it an owner, and measure it with data that does not come from the people who sponsored the deployment.
Why do AI business cases underestimate cost?
Because the model is the cheap part. Stanford's study of 51 successful deployments found 77% of the hardest challenges were invisible costs such as change management, data quality, and process redesign, and 61% of those projects followed an earlier failure whose spend never entered the final ROI.
Evidence
It survives a two-stage least squares specification instrumented by industry exposure to university-authored AI research, with a Cragg-Donald F-statistic of 118.83.
In the first stage, AI technology exposure is positively and significantly associated with AI mentions at the 1% level, and the Cragg and Donald (1993) F-statistic of 118.83 exceeds the Stock–Yogo (2005) critical value at the 5% level, suggesting that weak instruments are unlikely to be a concern.
Chen, S.-S., Kim, J., & Peng, S.-C. (2026). The real effects of AI: Evidence from corporate investment efficiency. Journal of Empirical Finance, 88, 101730. (p. 9)
The split underneath it is the part worth pinning to your wall: 0.747 when performance was captured through executive surveys, 0.188 when it came from objective financial data.
objective group was 0.188. The overall effect size
Tawse, A., & Tabesh, P. (2023). Thirty years with the balanced scorecard: What we have learned. Business Horizons, 66(1), 123-132. (p. 6)
McKinsey's private capital team analyzed 471 private-equity-backed companies across 31 industries and 30 countries, covering deals completed from 2023 onward, and sorted them into four levels of AI maturity.
Our analysis is based on a data set of 471 privately held companies that received equity or debt investment from a private equity fund at some point in their life cycle. We focused on deals completed from 2023 onward, with reported revenue data from the same period, to capture the phase of broader enterprise AI adoption. ... The sample spans 30 countries and 31 industries. ... Firms were classified into four AI maturity levels.
Pulido, A., Yegoryan, H., Bleys, J., & Haas, S. (2026). Beyond productivity: How AI creates value in private equity. McKinsey & Company. (p. 2)
A one-standard-deviation increase in AI mentions is associated with 2.17% higher investment efficiency at the mean and 3.65% at the median.
In terms of magnitude, a one-standard-deviation increase in AI mentions (0.137) corresponds to a 2.17% increase in investment efficiency when evaluated at the mean of 0.101 and a 3.65% increase when evaluated at the median of 0.060.
Chen, S.-S., Kim, J., & Peng, S.-C. (2026). The real effects of AI: Evidence from corporate investment efficiency. Journal of Empirical Finance, 88, 101730. (p. 9)
Tawse and Tabesh's 2023 meta-analysis in Business Horizons pooled the 11 published studies that quantified the relationship between balanced scorecard adoption and firm performance.
We identified 11 such studies.
Tawse, A., & Tabesh, P. (2023). Thirty years with the balanced scorecard: What we have learned. Business Horizons, 66(1), 123-132. (p. 5)
The median revenue multiples come out at 13x, 14x, 20x, and 31x across those four levels.
They also trade at a revenue multiple of 14x, compared with 13x for level-one companies. ... Our analysis shows that companies at this level trade at a median revenue multiple of 20x—43 percent higher than the median revenue multiple of 14x for level-two companies.
Pulido, A., Yegoryan, H., Bleys, J., & Haas, S. (2026). Beyond productivity: How AI creates value in private equity. McKinsey & Company. (p. 5)
A case with no second line is a level-two case, and the private-equity data says level two is priced at 14x against level one's 13x.
They also trade at a revenue multiple of 14x, compared with 13x for level-one companies.
Pulido, A., Yegoryan, H., Bleys, J., & Haas, S. (2026). Beyond productivity: How AI creates value in private equity. McKinsey & Company. (p. 5)
Pick indicators from the quality, customer value, and revenue families rather than defaulting to head count, which is the appendix the Stanford team wrote for exactly this reason.
Yet many teams default to a narrow set of efficiency-focused metrics — often measured by headcount reduction — while overlooking indicators of quality, customer value, and revenue growth that often prove more sustainable and impactful over time.
Pereira, E., Graylin, A. W., & Brynjolfsson, E. (2026). The Enterprise AI Playbook: Lessons from 51 Successful Deployments. Stanford Digital Economy Lab. (p. 108)
Across 16,145 firm-years, AI adoption did not show up as measurably cheaper existing work.
In untabulated tests, standard operating efficiency metrics (operating expenses, sales per worker, and revenue-based productivity measures) provide little systematic evidence of operating efficiency gains.
Chen, S.-S., Kim, J., & Peng, S.-C. (2026). The real effects of AI: Evidence from corporate investment efficiency. Journal of Empirical Finance, 88, 101730. (p. 15)
Standard operating efficiency metrics, meaning operating expenses, sales per worker, and revenue-based productivity measures, provide little systematic evidence of gains.
In untabulated tests, standard operating efficiency metrics (operating expenses, sales per worker, and revenue-based productivity measures) provide little systematic evidence of operating efficiency gains. This finding is broadly consistent with recent work suggesting that early AI adoption is more closely associated with growth and product innovation than with operating efficiency (Babina et al., 2024a).
Chen, S.-S., Kim, J., & Peng, S.-C. (2026). The real effects of AI: Evidence from corporate investment efficiency. Journal of Empirical Finance, 88, 101730. (p. 15)
Stanford's 51 deployments put 77% of the hardest challenges in invisible costs, and 61% of the successful projects had a prior failure whose spend never appeared in the winning project's ROI.
Technology is not the hardest part. 77% of the hardest challenges were invisible and intangible costs: change management, data quality, and process redesign. 61% of successful projects included at least one prior failure, whose costs never appear in the final ROI.
Pereira, E., Graylin, A. W., & Brynjolfsson, E. (2026). The Enterprise AI Playbook: Lessons from 51 Successful Deployments. Stanford Digital Economy Lab. (p. 11)
The authors state the implication directly: markets do not materially differentiate between companies that use AI for productivity and those that integrate it into their operating models.
This suggests that markets do not materially differentiate between companies that use AI for productivity and those that integrate it into their operating models. Valuations rise significantly only when AI is embedded in the offerings, changing what the company sells—not just how it operates.
Pulido, A., Yegoryan, H., Bleys, J., & Haas, S. (2026). Beyond productivity: How AI creates value in private equity. McKinsey & Company. (p. 6)
Chen, Kim, and Peng, publishing in the Journal of Empirical Finance in 2026, tracked 2,401 US firms over 16,145 firm-years from 2010 to 2021, measuring AI adoption by the density of AI terminology in senior management remarks on earnings calls and measuring investment efficiency as the deviation from expected investment given growth opportunities.
Using a sample of 16,145 firm-year observations for 2401 U.S. firms from the StreetEvents–Compustat–CRSP universe over 2010–2021, we examine how firms' AI adoption relates to investment efficiency. ... we define AI mentions as the ratio of AI-related keyword counts (Appendix C) in senior management remarks and responses during earnings calls to the total number of words in the corresponding transcripts.
Chen, S.-S., Kim, J., & Peng, S.-C. (2026). The real effects of AI: Evidence from corporate investment efficiency. Journal of Empirical Finance, 88, 101730. (p. 2)
Where that link was explicit, the effect size rose by 0.321.
increasing the effect size by .321.
Tawse, A., & Tabesh, P. (2023). Thirty years with the balanced scorecard: What we have learned. Business Horizons, 66(1), 123-132. (p. 5)
Deloitte's 2026 survey of 3,235 leaders, cited in the same report, found 74% of organizations hoping to grow revenue through AI and 20% doing it.
Revenue growth is the aspiration, not the reality. Deloitte's 2026 survey of 3,235 leaders found that 74% of organizations hope to grow revenue through AI, but only 20% are doing so today.
Pereira, E., Graylin, A. W., & Brynjolfsson, E. (2026). The Enterprise AI Playbook: Lessons from 51 Successful Deployments. Stanford Digital Economy Lab. (p. 59)
The paper also places the improvement in firms prone to underinvestment rather than overinvestment.
The results suggest that AI mentions is positively associated with investment efficiency for firms prone to underinvestment. The coefficient for overinvestment is [not significant]
Chen, S.-S., Kim, J., & Peng, S.-C. (2026). The real effects of AI: Evidence from corporate investment efficiency. Journal of Empirical Finance, 88, 101730. (p. 19)
The mechanisms the authors identify are all informational: lower management sales forecast error over multi-year horizons, less earnings management, and higher process and product patenting intensity.
Additional analyses suggest several mechanisms: AI adoption is associated with more accurate management sales forecasts, higher financial reporting quality, and greater process and product innovation intensity.
Chen, S.-S., Kim, J., & Peng, S.-C. (2026). The real effects of AI: Evidence from corporate investment efficiency. Journal of Empirical Finance, 88, 101730. (p. 1)
The recruiting deployment in Stanford's sample cut time per role from three hours to three minutes, and it also lifted candidate conversion by 75%, which I would count as a second line because conversion measures the hiring outcome and not the screening effort.
Time per role 3 hrs → 3 min ... Intake efficiency +83% ... Screening efficiency +79% ... Candidate conversion +75%
Pereira, E., Graylin, A. W., & Brynjolfsson, E. (2026). The Enterprise AI Playbook: Lessons from 51 Successful Deployments. Stanford Digital Economy Lab. (p. 27)
KPMG's estimated failure rate for scorecard adoption projects was 70%.
KPMG estimates a failure rate of 70% associated
Tawse, A., & Tabesh, P. (2023). Thirty years with the balanced scorecard: What we have learned. Business Horizons, 66(1), 123-132. (p. 2)
Median revenue per employee rises about 19% between levels one and two, then jumps from $118,000 to $180,000 between levels three and four, a 52% increase.
Revenue efficiency also rises sharply at level four: The median revenue per employee increases to $180,000 from $118,000 at level three—a 52 percent jump that significantly exceeds the 19 percent increase observed between levels one and two.
Pulido, A., Yegoryan, H., Bleys, J., & Haas, S. (2026). Beyond productivity: How AI creates value in private equity. McKinsey & Company. (p. 8)
Roughly half of adopters, 51% in one survey, treated the scorecard as financial and nonfinancial measures with no causal link between the measures and the goals.
that 51% of companies that adopted the BSC
Tawse, A., & Tabesh, P. (2023). Thirty years with the balanced scorecard: What we have learned. Business Horizons, 66(1), 123-132. (p. 4)
The overall effect size was 0.433, moderate and real.
size from the sample was 0.433.
Tawse, A., & Tabesh, P. (2023). Thirty years with the balanced scorecard: What we have learned. Business Horizons, 66(1), 123-132. (p. 5)
The Stanford researchers found revenue impact in a minority of their cases, and their explanation is one sentence long: what distinguished those cases was that someone measured the revenue side, not just the cost side.
Most implementations in our sample are measured as productivity or cost reduction. But a subset shows direct, quantified revenue impact. What distinguishes these cases is not the technology. It is that someone measured the revenue side, not just the cost side.
Pereira, E., Graylin, A. W., & Brynjolfsson, E. (2026). The Enterprise AI Playbook: Lessons from 51 Successful Deployments. Stanford Digital Economy Lab. (p. 60)